Using a text editor for writing code and a browser for viewing the results works well. However, you can increase your productivity by using two of the tools built into modern browsers:
- View Page Source and
- Inspect Element
Every modern browser has a number of web inspection and development tools built in. While it is beyond the scope of this article to cover everything in detail, I can still point you in the right direction and you can learn as you go along. You won’t use all the features and – depending on what you are doing – will focus on a small subset of the available features.
Contents
Overview
The tools vary a little from browser to browser, but the basic functionality is the same.
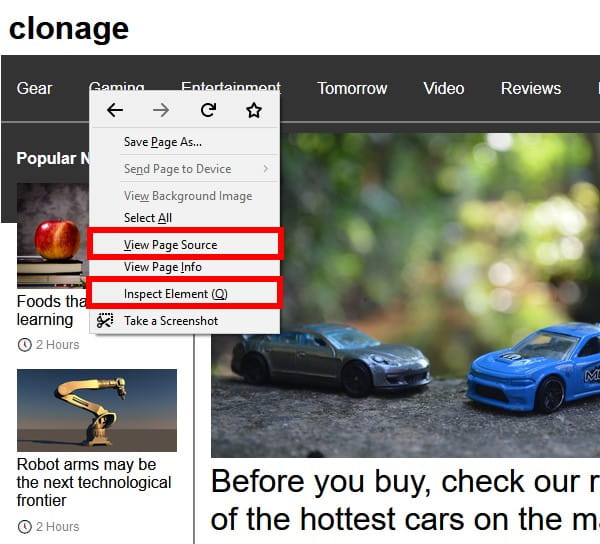
Right clicking on a webpage will bring up a menu with options. Depending on where you right-click, some options may not be available.1
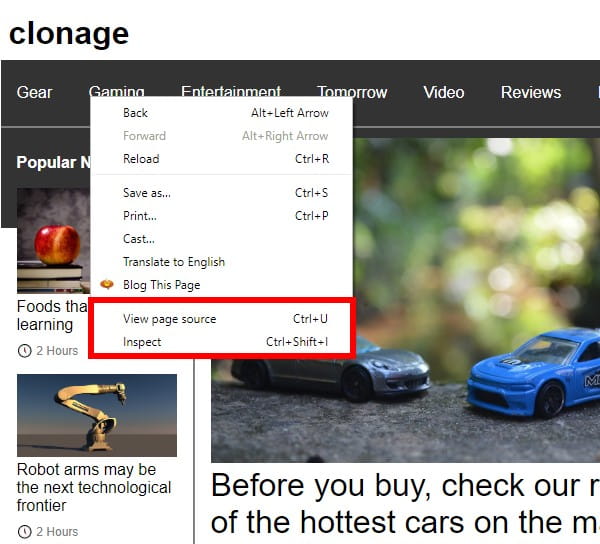
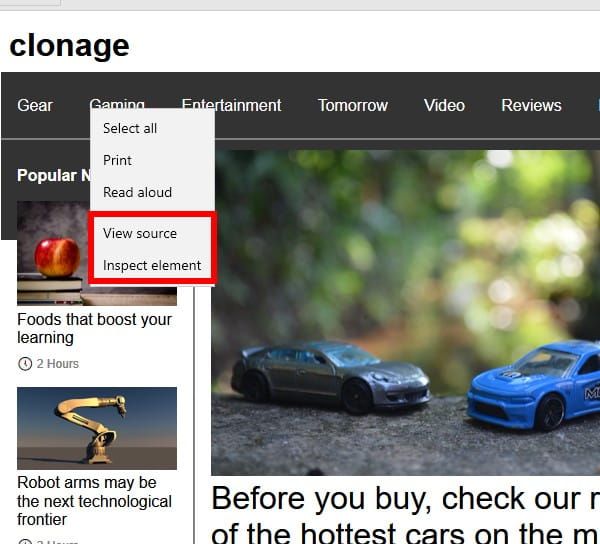
Below are 3 examples of the right-click menu from various browsers in January 2019:
FireFox
Chrome
Edge
View Page Source
Depending on the browser being used, the name might vary a bit, but it will probably have the word source in it.
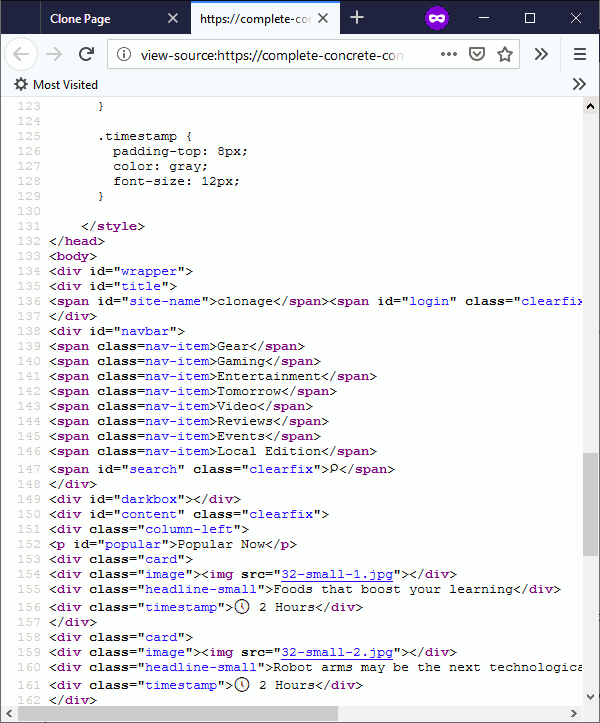
When you select this menu item, it will open a new2 tab and display the HTML code of the page. This is a good way for you to inspect the actual HTML code making up the page or to print it out.
Selecting View Page Source on the previous example page in Firefox 64 looks something like this:3
Inspect Element
Inspect Element offers a wealth of features to you – well beyond the scope of this article to explore – but feel free to explore on your own.
You don’t have to worry about damaging the web page or accidentally overwriting your code because browsers cannot modify the source files – only what is being displayed. A fresh reload overwrites any changes you have made.
Depending on the browser being used, the name might vary a bit, but it will probably have the word Inspect in it.
Your browser will split its display window and show the webpage in one section and the HTML and other information in another section. It will go to the location in the HTML source that chose to inspect.
Selecting Inspect Element on the previous example page in Firefox 64 looks something like this:4
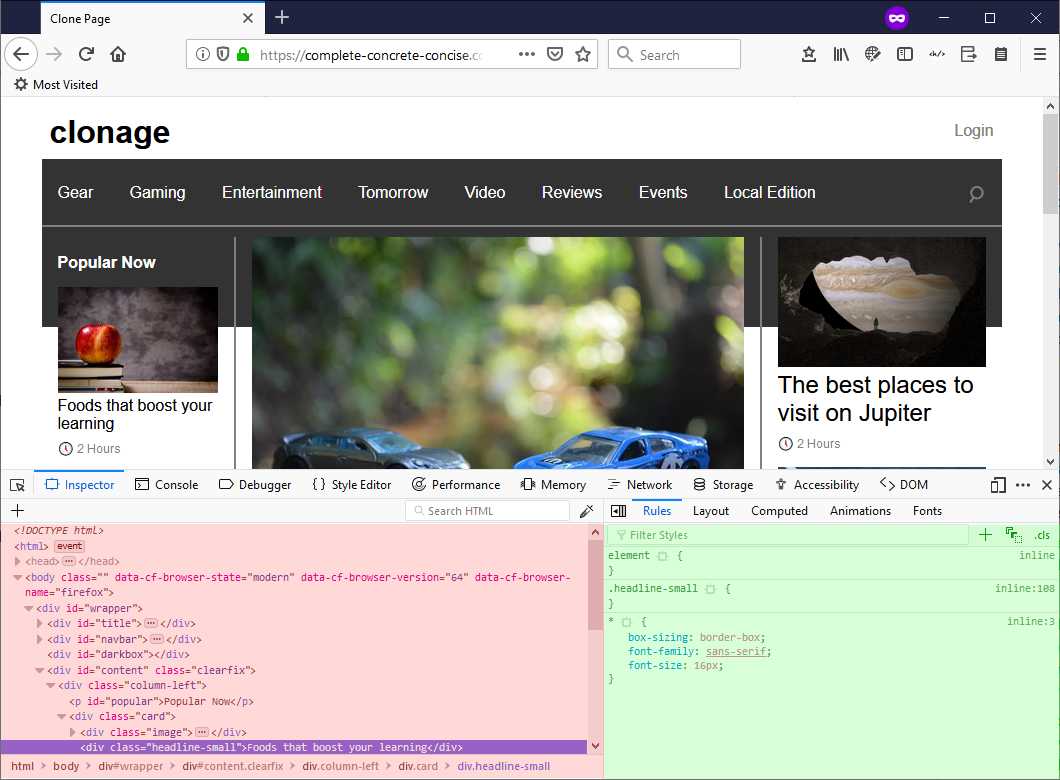
HTML Elements
One of the inspector panes should display the HTML source code – shaded in red in the image above.
- As you move your mouse over the HTML elements, you will notice that parts of the webpage get shaded. This shows you which part of the webpage this element affects.
- You can left-click on the little triangles found on the left-hand side to expand elements and inspect their sub elements.
- Right-clicking on an element will bring up a menu with various options. These often include: edit as HTML and delete element. (don’t worry about damaging your source code, any changes you make in the Element Inspector are not permanent – you can always reload the page to get back to the original).
CSS Styles
Another inspector pane should display the CSS styles being applied to the selected element – shaded in green in the image above.
- You can disable a particular style by unticking the checkbox.
- You can edit the value of a CSS attribute by right-clicking it.
- You can add more CSS attributes by right-clicking just after the last CSS style element.
Experimenting
There are many options available and it is impossible to cover all of them here. However, feel free to experiment and use a search engine to research the various features.
In general, it should be fairly self-obvious what things are doing. At the moment, you should restrict yourself to just the HTML source and CSS styles. You are free to explore further.
Final Comments
The more you play, work, and practice with these tools, the more familiar they will become and the easier they will be to use.
You are likely to only use a small subset of the features available in Inspect Element.
If you use this to inspect live websites, you will – very likely – find they are much more complicated than what you have learned so far. Don’t worry about it.
Many websites are built around something called a CMS (Content Management System) – like WordPress. Content Management Systems automate a lot of things for you and often do many extra things. While the output of a CMS is HTML + CSS, the backend relies on other languages to generate the HTML + CSS displayed in the browser. You still have to be able to create the HTML and CSS and then (programmatically) instruct the CMS when and how to send it to the browser. As a someone learning about web development and starting out with fundamentals of HTML and CSS, you don’t need to worry about all that.
Another thing many websites include is JavaScript code – which you haven’t seen either.
Focus on getting the fundamentals down and writing clean, well structured HTML and CSS first before worrying about how to integrate it with a CMS or using JavaScript on your pages.
- This usually happens when you click on an image or video. Just right-click somewhere else on the webpage.↩
- Depending on your browser (or browser settings) it might open in your current tab instead.↩
- Different browsers and browser versions may display things slightly differently.↩
- Different browsers and browser versions may display things slightly differently.↩